
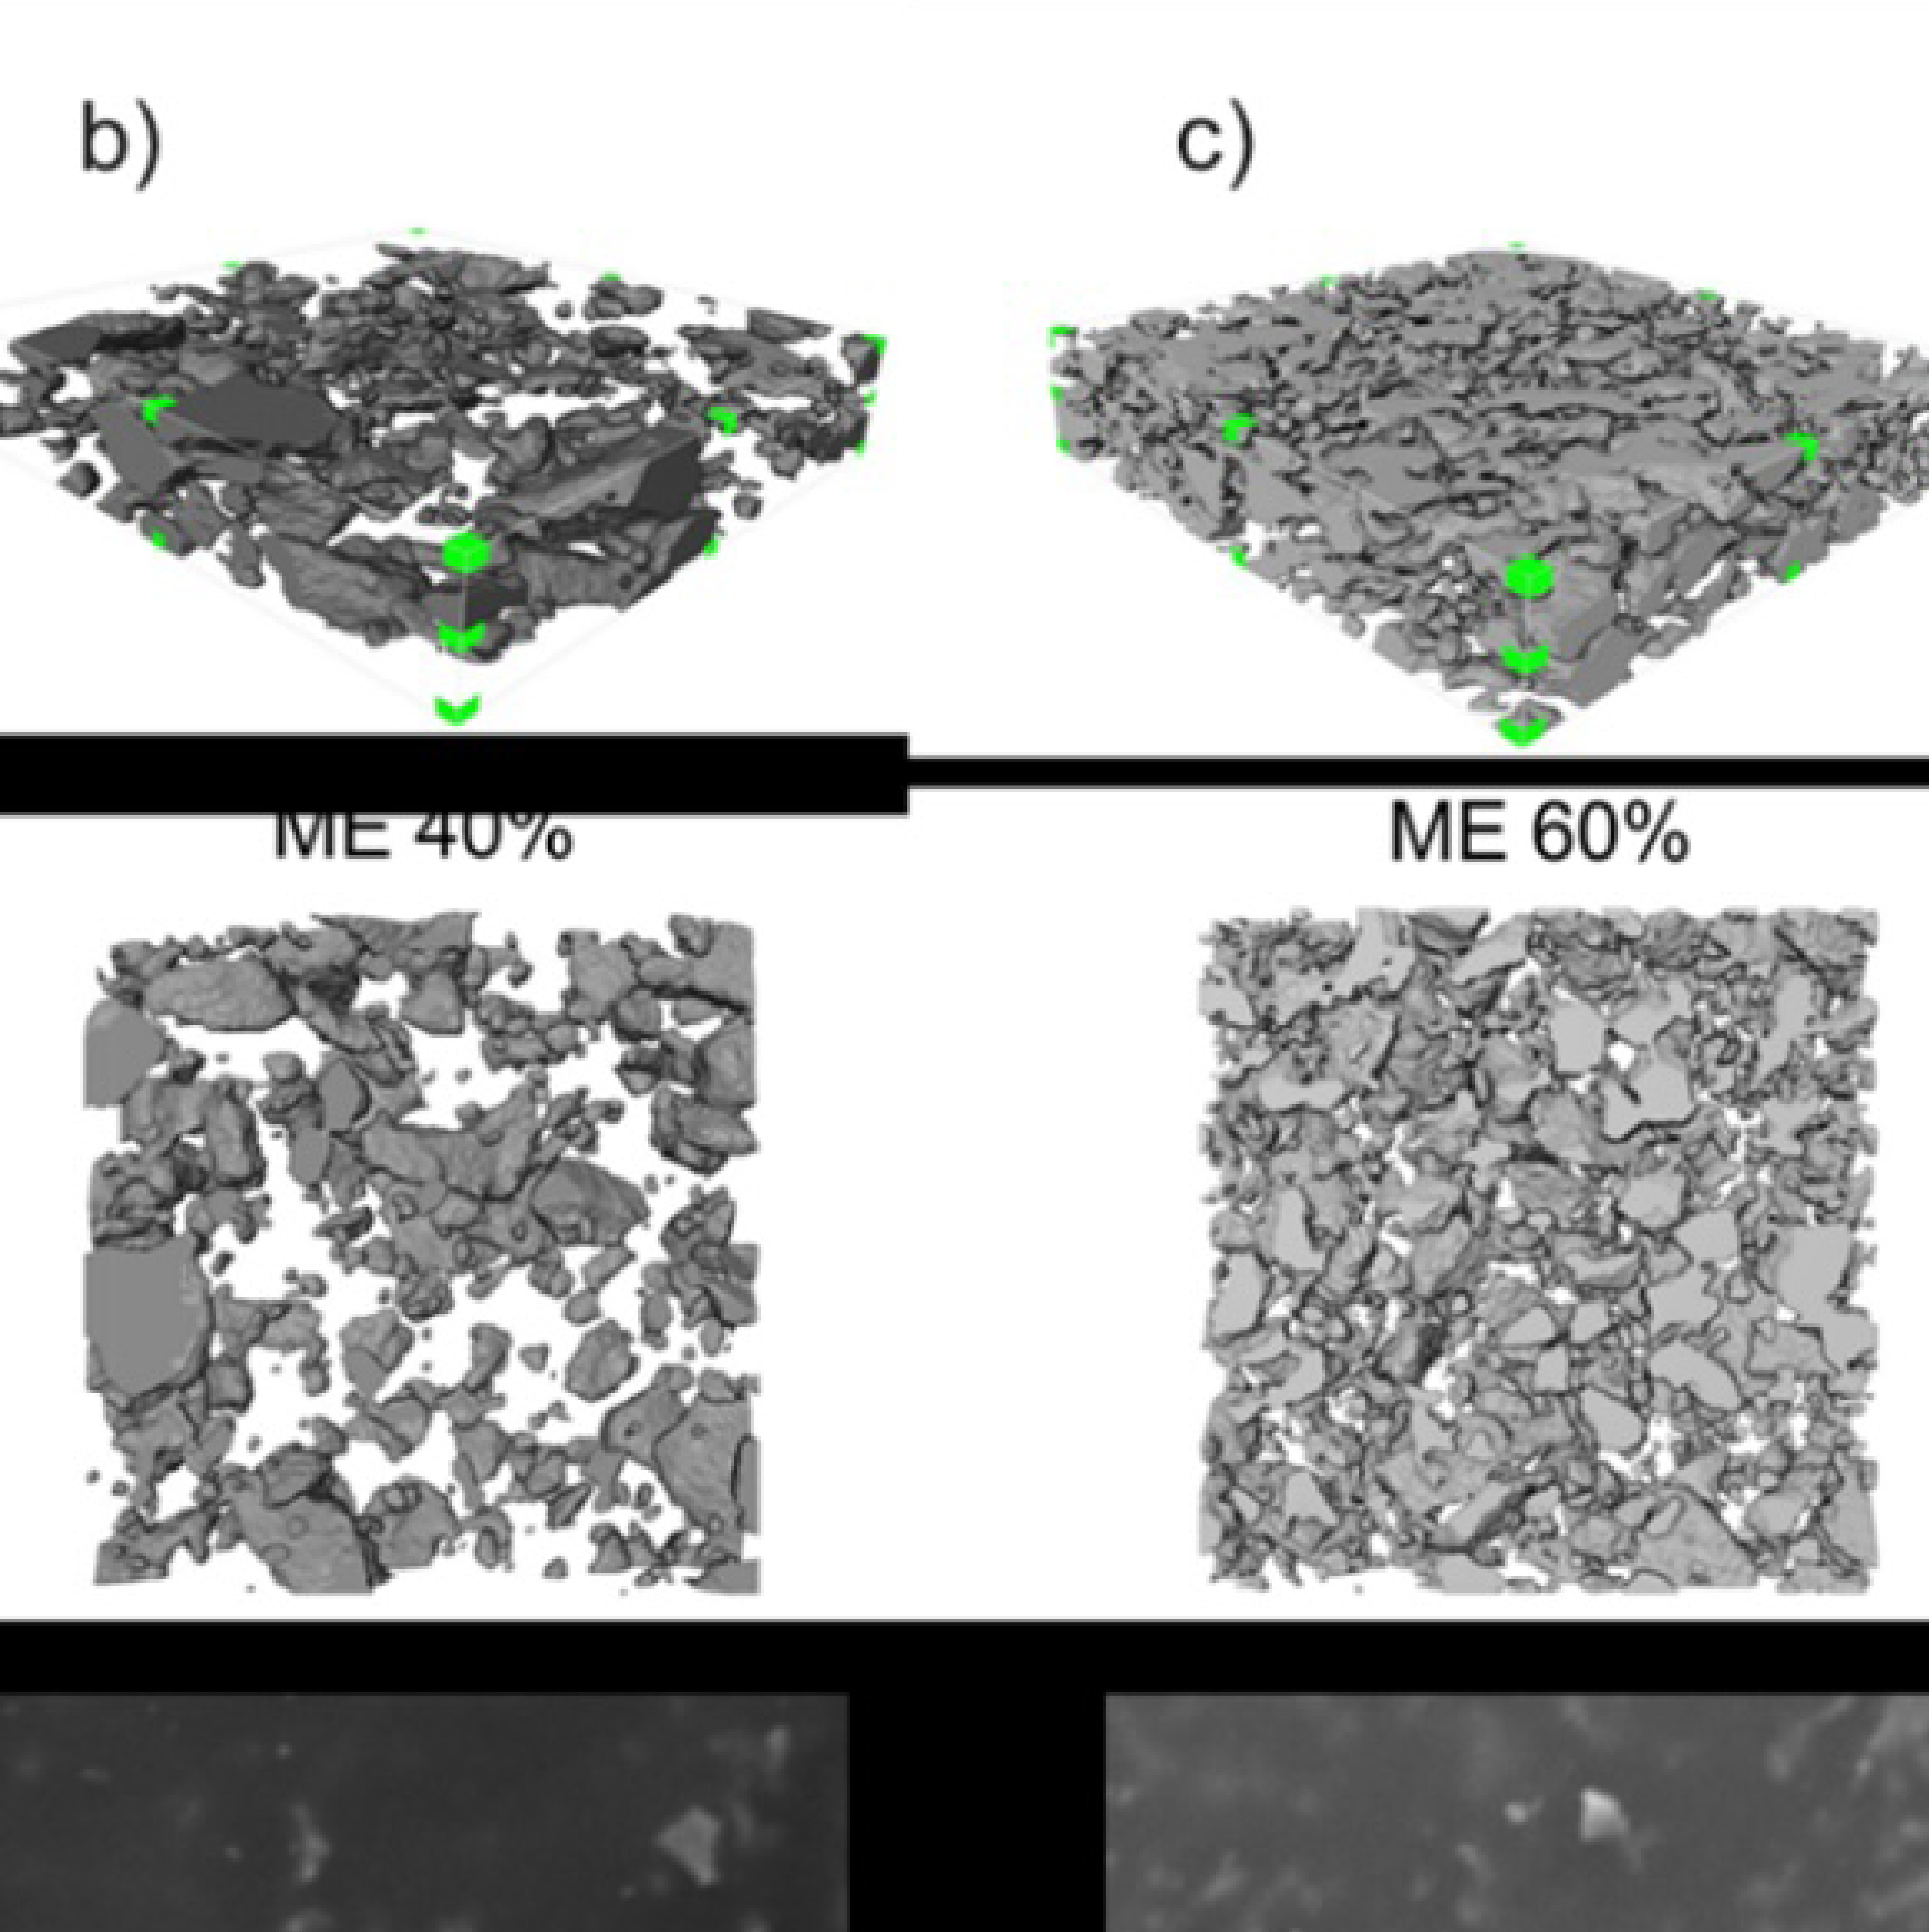
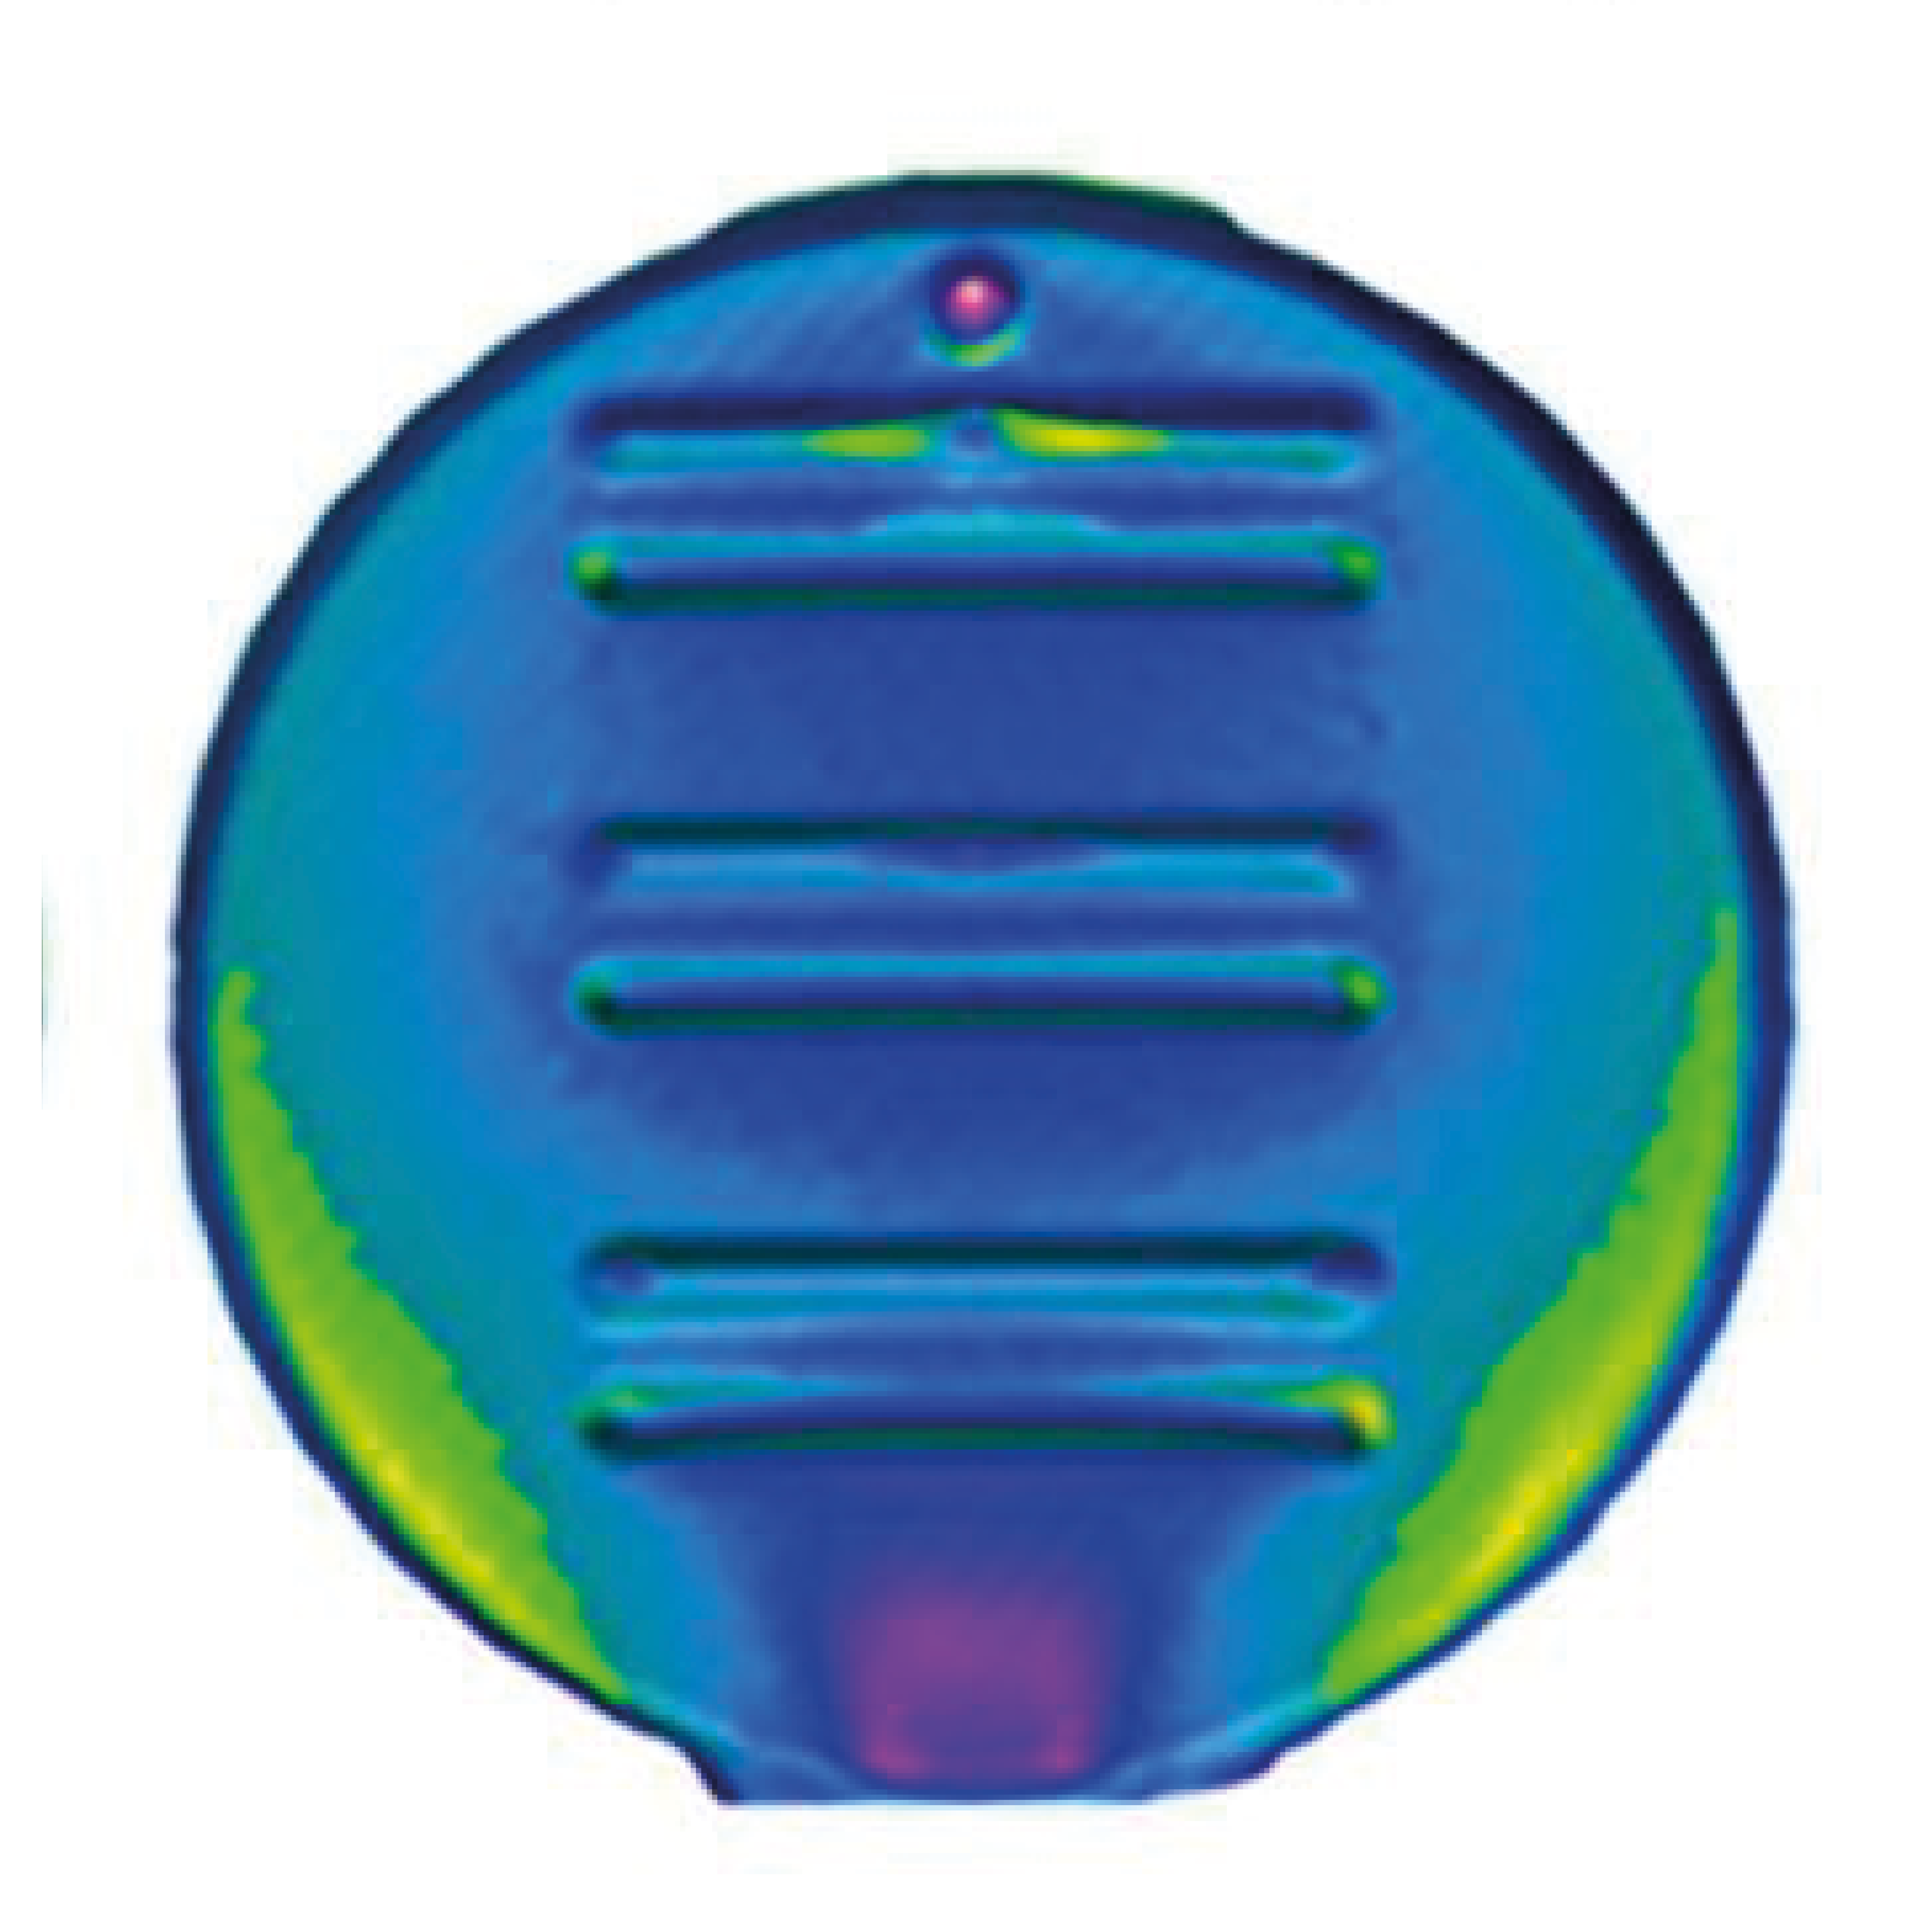
3D Microstructure of Soft Magnetic Elastomer Membrane
Soft magnetic elastomer membranes enable fast magnetic actuation under low fields. In our project, we… Read More
Events & Resources
News, Events and Resources from NXCT Partners
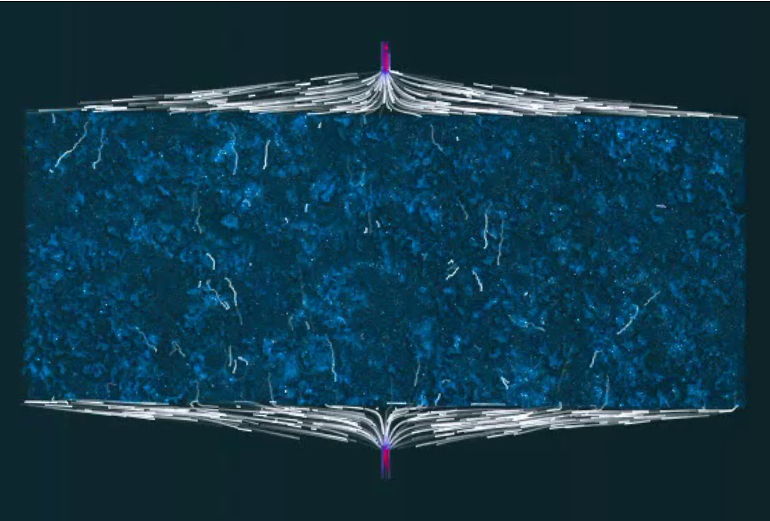
Hydraulic Fracture mechanics is widely studied in the laboratory. However, fewer studies combine image analysis to properly quantify the fracture properties and the factors that influences them as well as the resultant output (improved permeability).
Tensile fracture properties were studied in Crab Orchard sandstone and Darley Dale sandstone to investigate the effect of porosity on the fracture properties (tortuosity and thickness). Prior to using NXCT facilities, I was not able to scan large samples of Darley Dale sandstone at high resolution because of geometrical constraints of more conventional XCT set-ups. Also, I struggled to process the XCT images due to the huge size of the data (this was caused by the fact that we scanned a large region of interest at high resolution), but I was able to gain access to a high specification workstation through an NXCT facility.
Through the NXCT I was able to scan the Darley Dale sandstone samples and process the datasets using the top-level high spec workstations hosted at the University of Southampton’s data visualisation suite. So I was able to compare the fracture properties in very low porosity sandstone (Crab Orchard sandstone) and the low porosity sandstone (Darley Dale sandstone).
“The knowledge of the deformation processes of Earth material gives better insight on the safe practices in optimizing mineral resources exploration and exploitation. As we use the Earth to sustain our lives we should also ensure the Earth is safe.”
Ibemesi Peter Onyedikachi
University of Portsmouth
PhD student
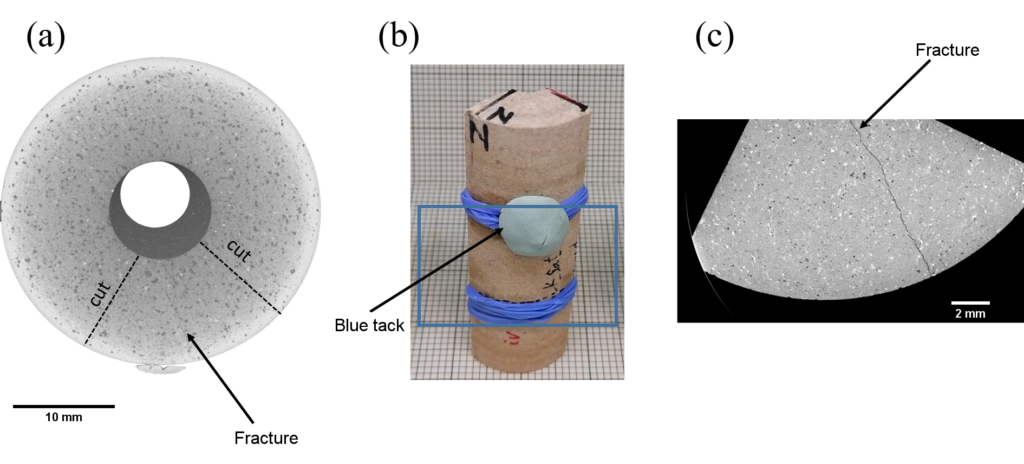
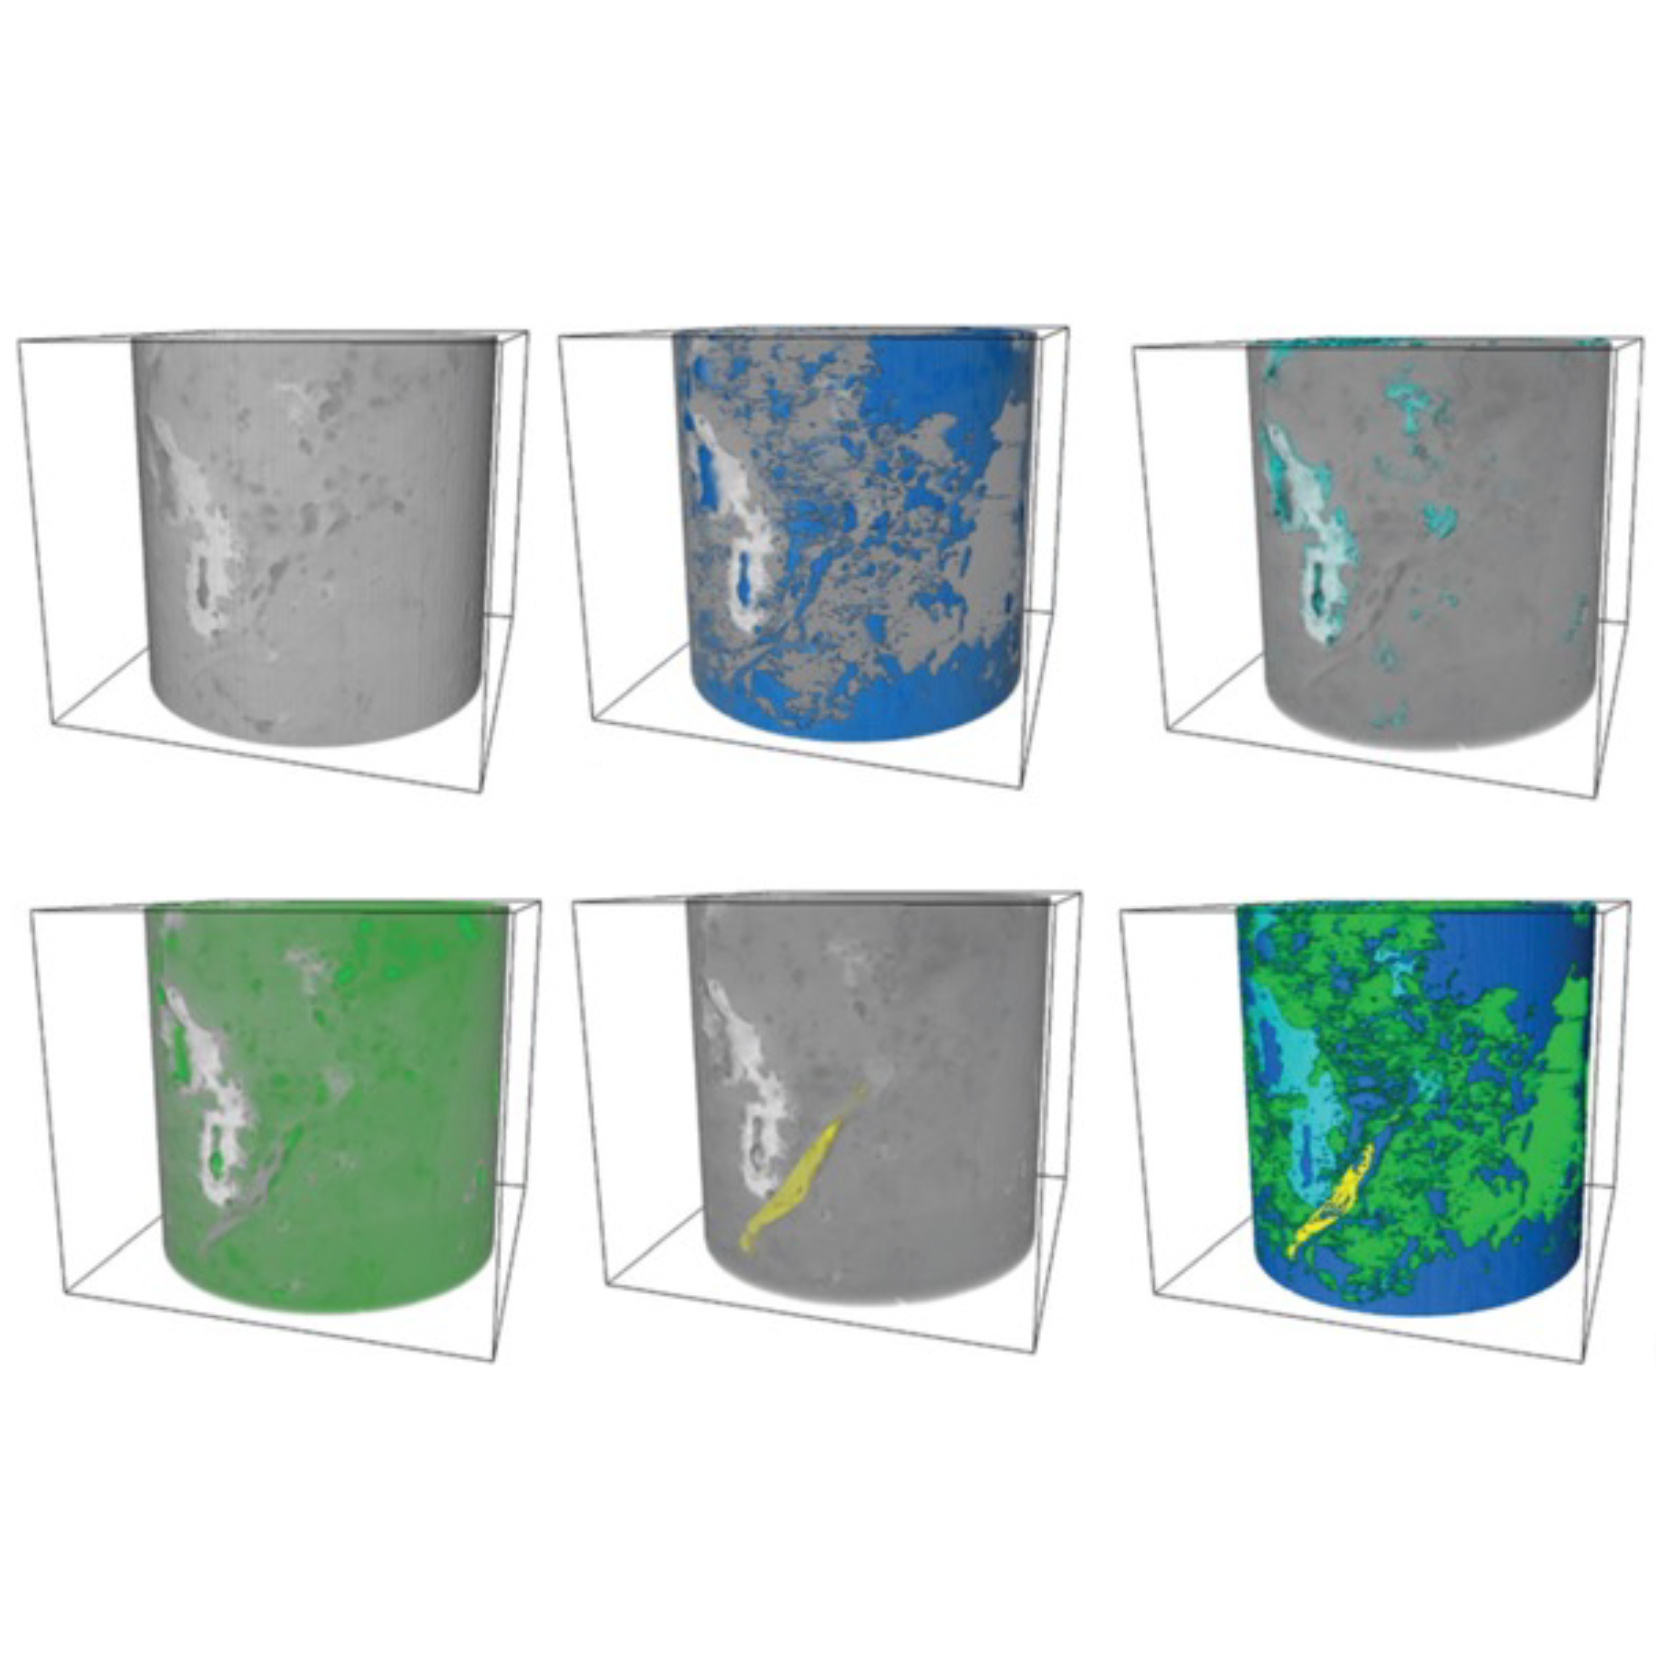
Figure 1. (a) 3D render of overview XCT scan of sandstone sample at 9 µm/voxel showing fracture location and approximate cutting paths; (b) sample quadrant cut from whole sample (blue tack used as marker for sample top); (c) 2D XY slice of XCT scan of sample quadrant scanned at 6.6 µm/voxel showing fracture detail.
Soft magnetic elastomer membranes enable fast magnetic actuation under low fields. In our project, we… Read More
Nowadays, the increasing capability of micro-manufacturing processes enables the manufacture of miniature products with extremely… Read More
Injection of CO2 into shale reservoirs to enhance gas recovery and simultaneously sequester greenhouse… Read More
